

Portfolio
MSc Finance - Master Thesis
FOMC FOMO – Robinhood Trading Patterns Surrounding FOMC Announcements
Author - Juan Rodriguez
Investigate trading behavior of Robinhood users during FOMC (Federal Open Market Committee) announcements between May 2018 and August 2020.
Main Focus
Methodology
Mean-Adjusted Event Study: Measures abnormal activity in a T-5 to T+5 window compared to a T-25 to T-6 baseline.
Robintrack Portfolio (RTP): Holder-weighted portfolio to proxy user wealth and compare against SPY performance.
Data
Data for Robinhood traders is sourced from Robintrack.net, a public website that utilized an API provided by Robinhood. The platform collected the number of open positions across a wide range of equities. It contains 8,597 csv files, each corresponding to a specific ticker, with a total size of 3.69 Gigabytes.
Findings
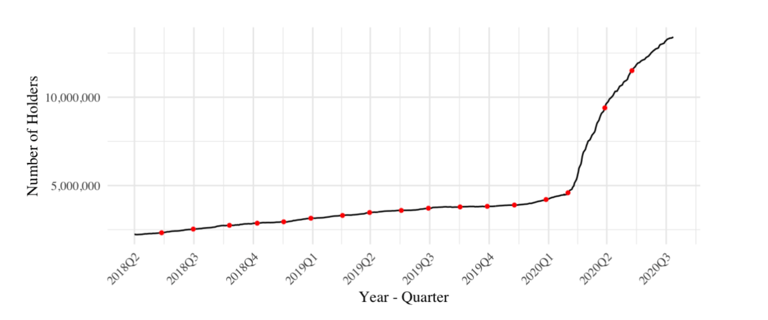
A major increase in Robinhood trader activity occurred around March 3, 2020, coinciding with the onset of COVID-19 and market volatility. Rather than panic selling, traders stayed active, aligning with Welch’s (2022) view that they helped sustain market liquidity. The surge may have been driven by expectations of a market rebound, though this remains speculative.
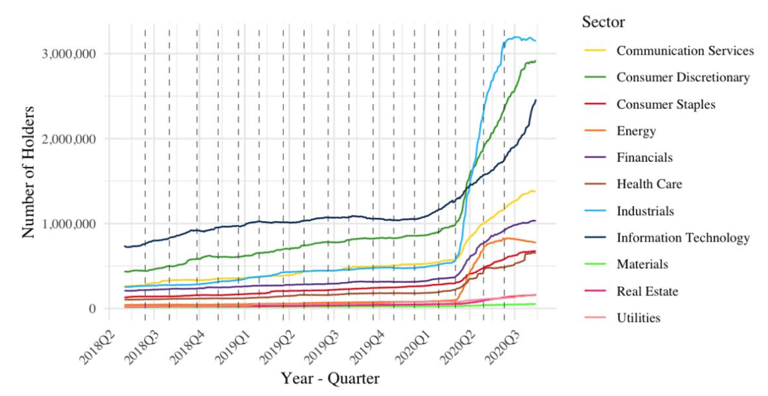
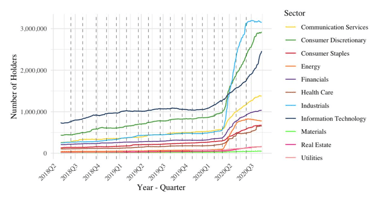
Robinhood Sector Holders Over Time
Before 2020, all sectors saw modest growth, with Information Technology leading. During the COVID-19 shock, Industrials spiked as Robinhood traders heavily bought stocks like American Airlines and Boeing following pandemic-related sell-offs. This behavior reflects the “buy the dip” pattern identified by Grinblatt & Keloharju (2001) and Barber & Odean (2008), where retail investors purchase stocks after sharp declines, expecting a rebound.

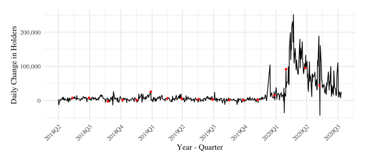
Daily Change of Holders Over Time
Daily changes in Robinhood holders were low in volatility and mostly positive. This changed between late 2019 and early 2020, with a spike in activity starting between announcements 13 and 14, and peaking between announcements 15 and 16, when daily increases surpassed 200,000 holders. After this surge, activity plateaued at a higher, more stable level than in 2018–2019.

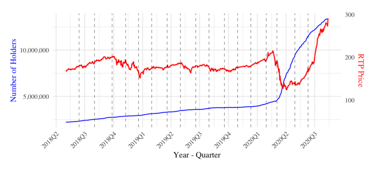
Overall holders Vs RTP price
While wealth initially declined due to COVID-19, it rebounded sharply after Q2 2020. Unlike the number of holders, the RTP price continued rising without plateauing. Factors such as quantitative easing, low interest rates, and market panic likely benefited Robinhood traders. Additionally, it's speculated that stimulus checks and PPP funds from the CARES Act and its $484 billion expansion may have flowed into the equity markets via retail investors.
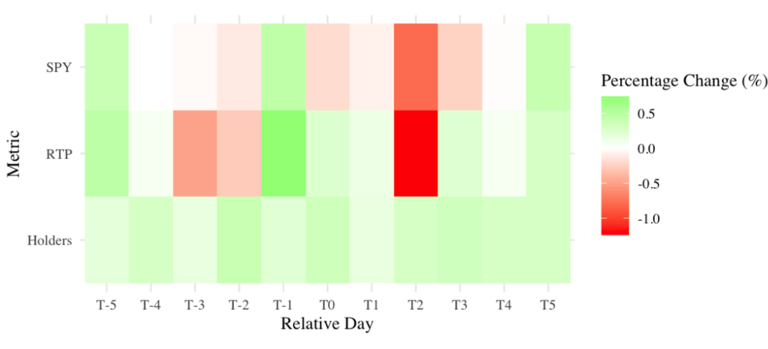
SPY, RTP and Overall Holders Heatmap
Day-over-day percentage changes show that the number of Robinhood holders consistently increased without turning negative, unlike SPY and RTP, which displayed more variability. A heat map revealed higher inflows into SPY and RTP on the day before FOMC announcements (T-1), aligning with Lucca and Moench (2015). However, an unexpected sharp decline occurred on T+2, which is puzzling since FOMC information is disclosed on T0, making a delayed post-announcement drop difficult to explain.
Robinhood Holders Over Time

Supervisor - Dr.Thomas Grünthaler

Main Focus
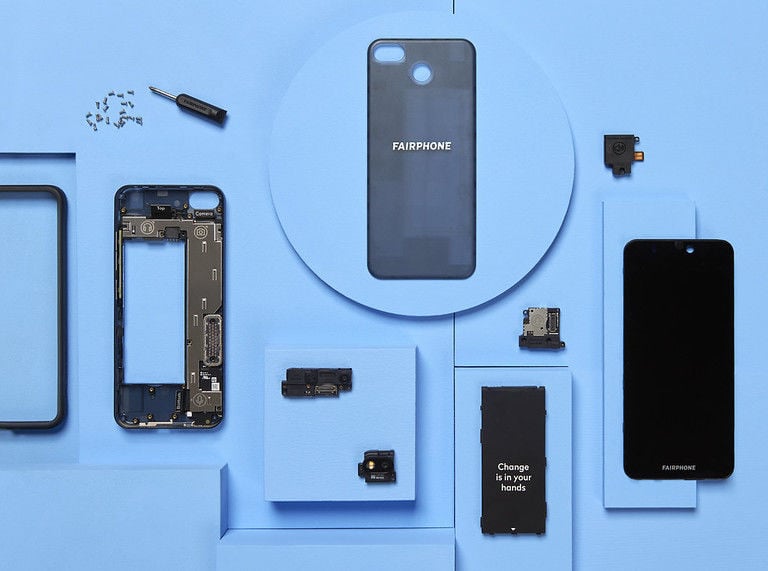
Assess the perception and awareness of Fairphone and its subscription model among the target audience. Identify psychological, financial, and behavioral barriers to entry. Deliver actionable insights and marketing strategies to enhance adoption
Methodology
Five analytical pillars: demographics, pricing and terms, business model, consumer preferences, sustainability, and product specifications. Using Quantitative and Qualitative research
Data
A quantitative survey with 192 respondents and a series of qualitative deep-dive interviews with 25 participants.
Findings
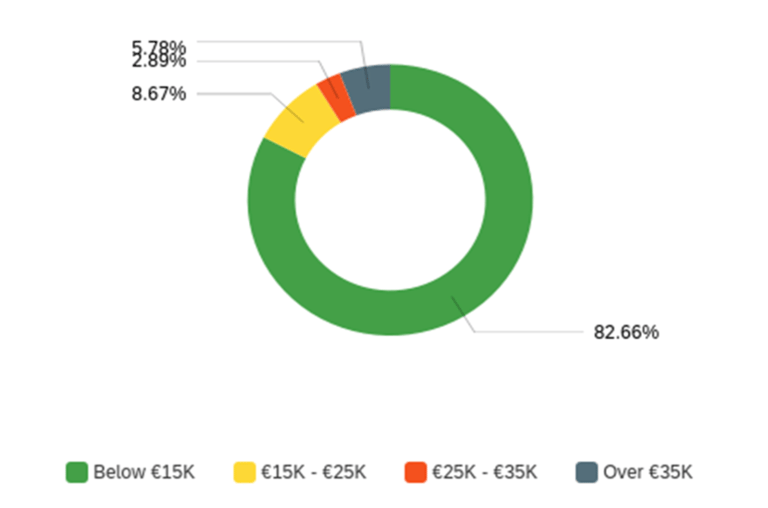
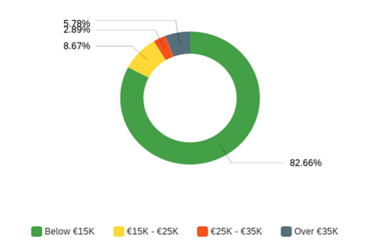
94% of respondents reported annual incomes below the Dutch median, indicating affordability challenges. While sustainability is valued, it is deprioritized when it entails a higher cost.
Price Sensitivity and Income Constraints
Brand Loyalty and Ecosystem Lock-in
Apple users, who represented a significant portion of the sample, demonstrated high brand loyalty and resistance to switching due to ecosystem compatibility.

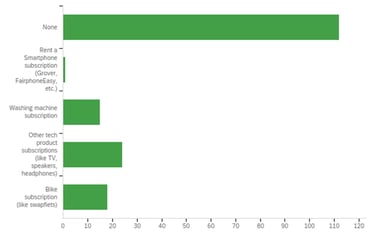
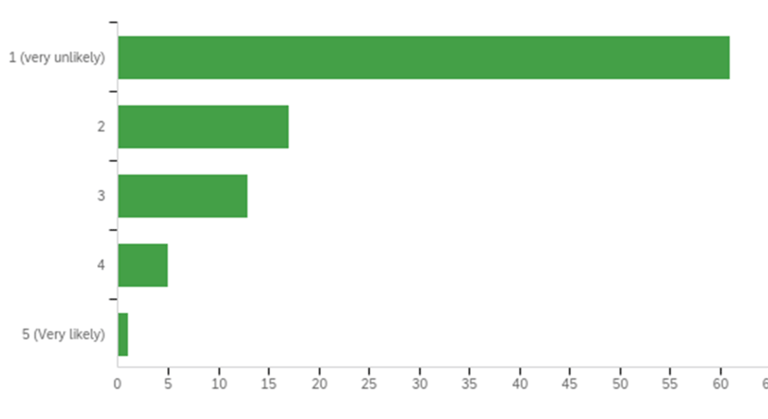
Reluctance Toward Subscription Models
Strong preference for ownership, particularly with personal devices like smartphones. Negative sentiment towards monthly deductions and the notion of “renting” a phone.